Linear regression
Linear regression fits a model predicting single dependent variable (label) via multiplication of one or many independent variables (features) by their respective coefficients.
Watch on YouTube: Performing a linear regression in Google Sheets with TableTorch 7:16
TableTorch provides a rich feature set for regressions:
- both the ordinary and weighted least squares methods for estimating the coefficients;
- train-validation split;
- k-fold cross-validation;
- stratified sampling;
- sampling with replacement.
Upon fitting the model, TableTorch can insert prediction column with a formula for label estimation, as well as create regression summary sheet. The formula can then be directly used on any other data containing the same features (columns) to estimate the label.
In the following sections, we will fit the most simple regression predicting the selling_price column of vehicle dataset. For more information about various learning and sampling options, see the fine-tuning regressions page.
- Start TableTorch
- Fitting with default settings
- Insert prediction column
- Add summary sheet
- Conclusion
Start TableTorch
- Install TableTorch to Google Sheets via Google Workspace Marketplace. More details on initial setup.
- Click on the TableTorch icon
 on right-side panel of Google Sheets.
Fitting with default settings
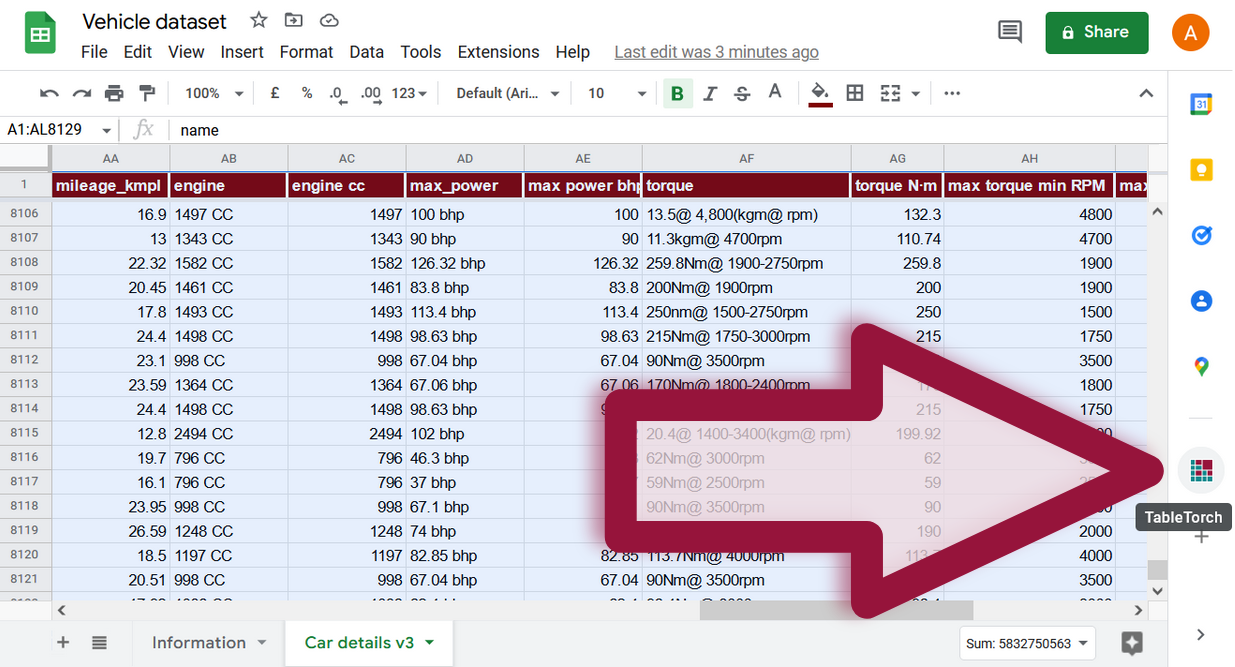
Select the whole range of the sheet and click Linear regression menu item inside TableTorch.
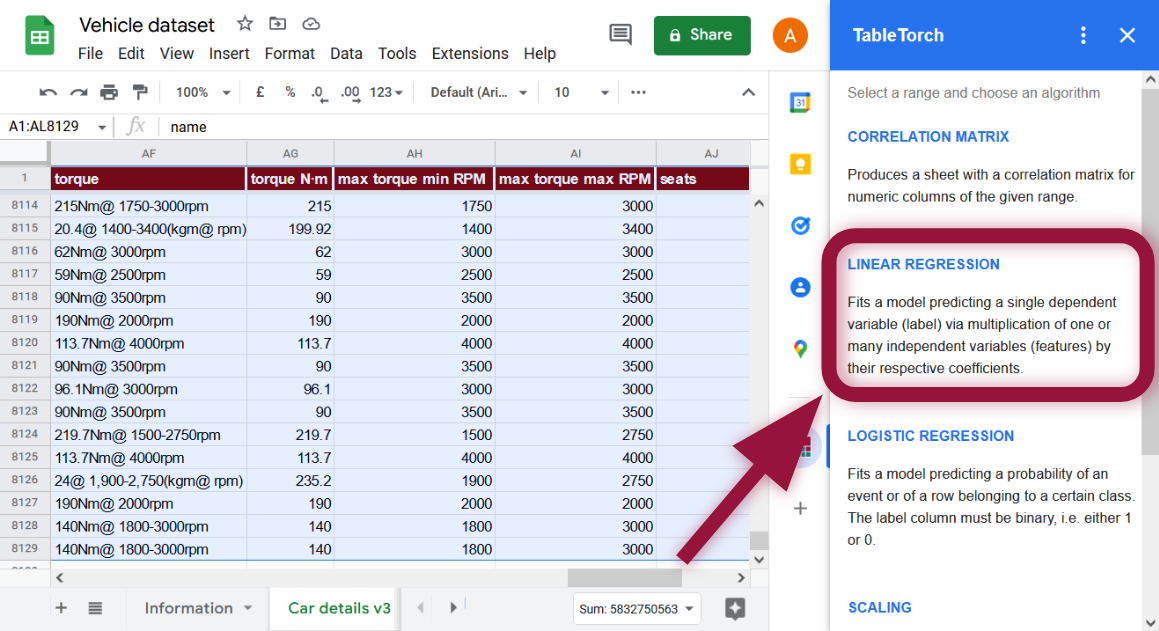
Non-numeric columns will be automatically filtered out.
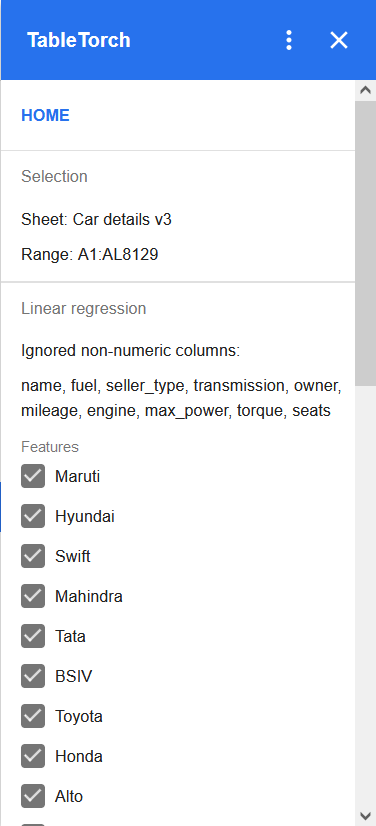
The last column more than 5 seats is selected as label
by default. As our aim is to predict a different column’s value,
change the label to selling_price as follows:

It does not make any difference whether selling_price
is checked in the features list or not because it is selected as the
label, TableTorch will automatically exclude selling_price
from the features list.
Click Fit model button.
![]()
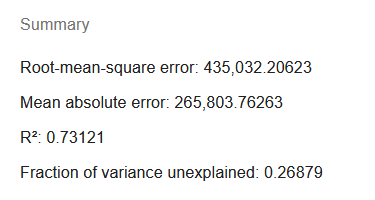
The following results panel will appear:
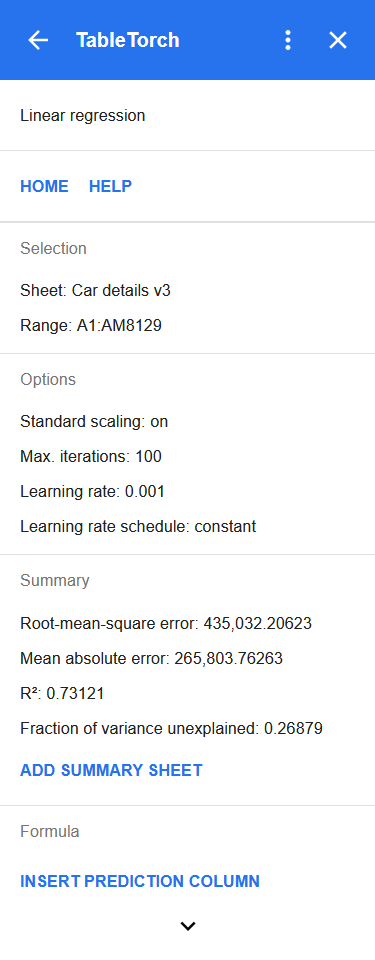
The panel shows the selected range, main learning options, and most importantly, critical metrics of the learning summary:
- Root-mean-square error (RMSE) and mean absolute error (MAE): most frequently used metrics for measuring average deviation between predictions and observed values.
- R² (r-squared): also known as the coefficient of determination, is the share of the dependent variable’s variation that the regression succeeded in predicting from the independent variable(s).
- Fraction of variance unexplained: being equal to
1 - R²represents the share of variation that the regression did not succeed in estimating from the independent variable(s).
Let’s take a closer look at the produced summary.
Note that repeated regression on the same range may produce different results due to data shuffling that TableTorch performs before and in-between iterations so as to improve robustness of the fitted model.
The MAE is in excess of 260,000, that is about 41% of the average selling price of 638,272 or more than half of median price of 450,000. Depending on our aims, this might or might not be an acceptable level because it is yet unknown which particular rows push the level of MAE to such highs, may be this is just due to a few expensive luxury cars.
R² turned to be around 0.73 which, again, might be acceptable depending on the circumstances. However, it is definitely not bad for the first try as we did not exclude any columns based on our correlation matrix analysis, did not exclude outliers and did not fine-tune the learning and sampling options yet.
The better the regression is, the lower RMSE and MAE and the higher R² are to be expected. However, these metrics identify different aspects of regression and must be taken into account together when a decision of model’s acceptance is being made.
These other possibilities are explored in fine-tuning regressions article.
For now, let’s take a look at how to use the fitted model before we dig into fine-tuning.
Insert prediction column
There’s Formula section at the bottom of regression summary panel providing the Insert prediction column button.
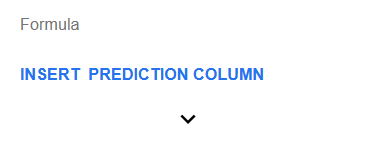
Click it to insert a column after the analyzed range with a formula
estimating the selling_price column’s value.
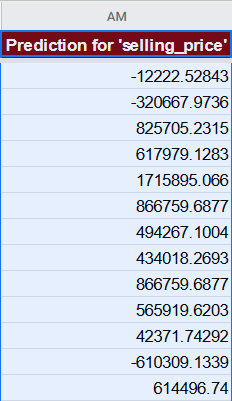
For the first row, the formula will look like the following one:
=639827.171051266 + ((B2 - 0.301181102362204) / 0.458799459127852) * -13624.7005345943 + ((C2 - 0.174089566929133) / 0.379209812049647) * -78332.2214570537 + ((D2 - 0.0962106299212598) / 0.294898023096581) * -40904.9165485197 + ((E2 - 0.0949803149606299) / 0.293205783883989) * -54328.4653464246 + ...
As standard scaling is enabled by default, TableTorch has trained the model on scaled data hence the prediction formula also contains the scaling instructions and has the following format:
=modelIntercept +
  ((Col1 - Col1Mean) / Col1StdDev) * Col1Coefficient +
  ((Col2 - Col2Mean) / Col2StdDev) * Col2Coefficient +
  ... +
  ((ColN - ColNMean) / ColNStdDev) * ColNCoefficient
It is now possible to do all kinds of different analyses on the prediction column, e.g. evaluating errors for particular strata so as to better understand the model’s strengths and weaknesses or to devise changes to the data or the learning options in order to obtain a better model.
Furthermore, if the model is deemed to have acceptable performance, it is possible to easily apply it to new data by just copying and pasting the formula to another range with identical columns structure. For example, if we have some new car data without determined selling price, we could use the model to help us guess the price.
Add summary sheet
Another useful feature of the regression results panel is the Add summary sheet button under the Summary section.
![]()
A click on it will insert a new sheet with a more detailed summary of the regression.
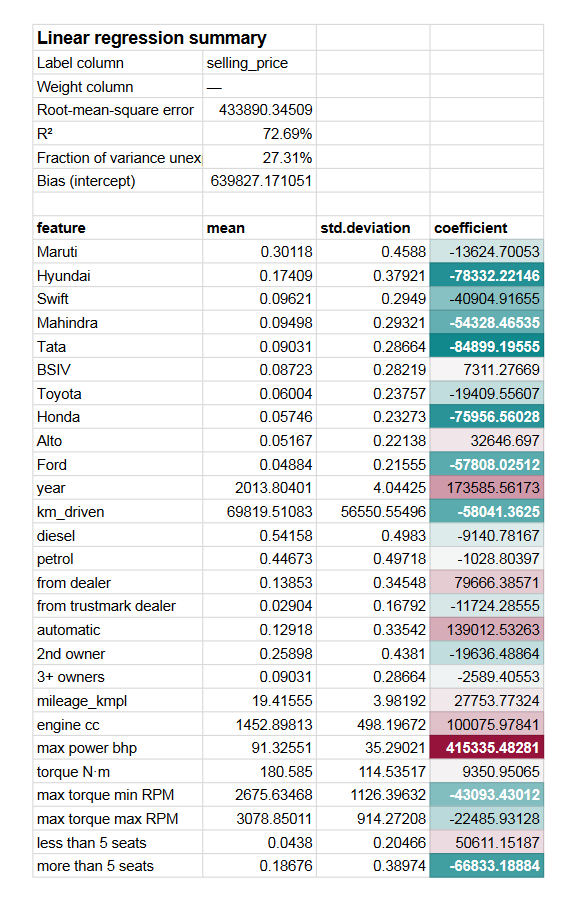
In addition to the metrics like R² and RMSE that are also present on the regression results panel, the summary sheets shows:
- Model’s intercept (bias). This is the value that could not be explained via independent variables alone.
- Each feature’s coefficient and, if standard scaling was enabled, also their respective means and standard deviations. The coefficients are highlighted in a way that helps to quickly identify the most significant ones.
Conclusion
TableTorch produces a usable model even with default settings. However, it also has many helpful options to improve the regression performance. See the fine-tuning regressions page to review these options as well.
See also:
Google, Google Sheets, Google Workspace and YouTube are trademarks of Google LLC. Gaujasoft TableTorch is not endorsed by or affiliated with Google in any way.
Let us know!
Thank you for using or considering to use TableTorch!
Does this page accurately and appropriately describe the function in question? Does it actually work as explained here or is there any problem? Do you have any suggestion on how we could improve?
Please let us know if you have any questions.
- E-mail: ___________
- Facebook page
- Twitter profile