Data scaling
TableTorch Scaling tool scales the data accordingly to specified options and inserts a separate sheet with the results. It supports several methods of numeric data scaling that can help achieve subsequent superior results with linear regressions as well as other statistical analysis tools.
We will use vehicle dataset as an example and review various scaling options in the following sections.
Start TableTorch
- Install TableTorch to Google Sheets via Google Workspace Marketplace. More details on initial setup.
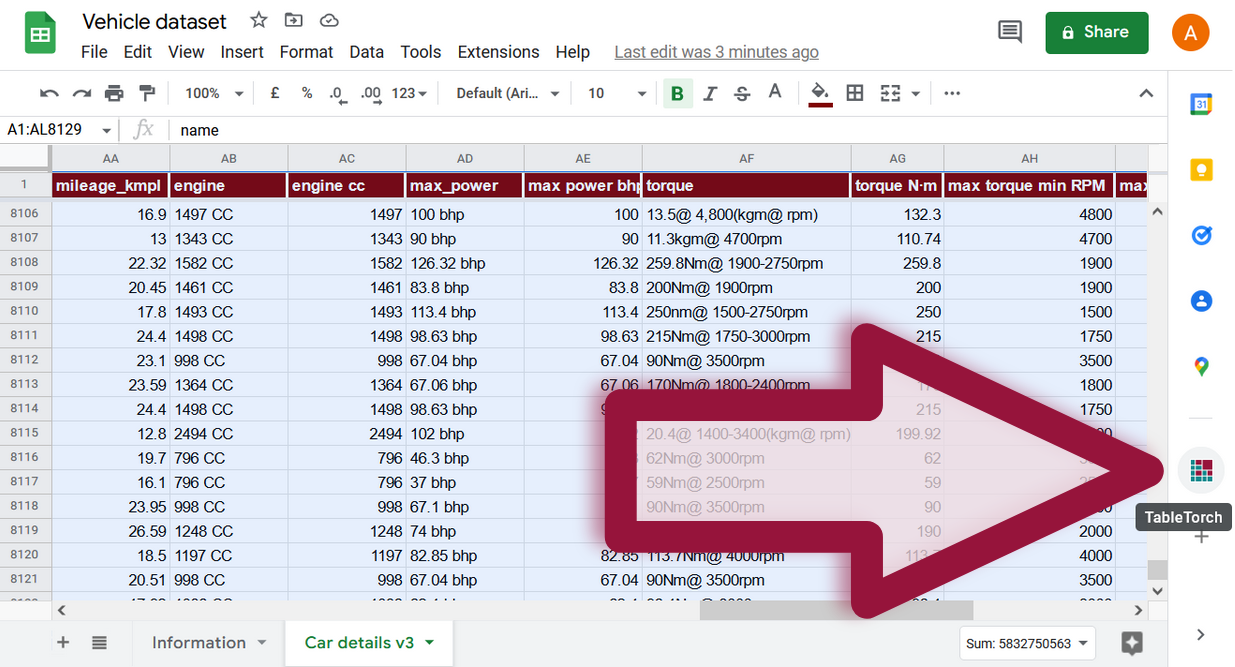
- Click on the TableTorch icon
 on right-side panel of Google Sheets.
Overview
Select the whole range of the sheet and click the Scaling menu item inside TableTorch.
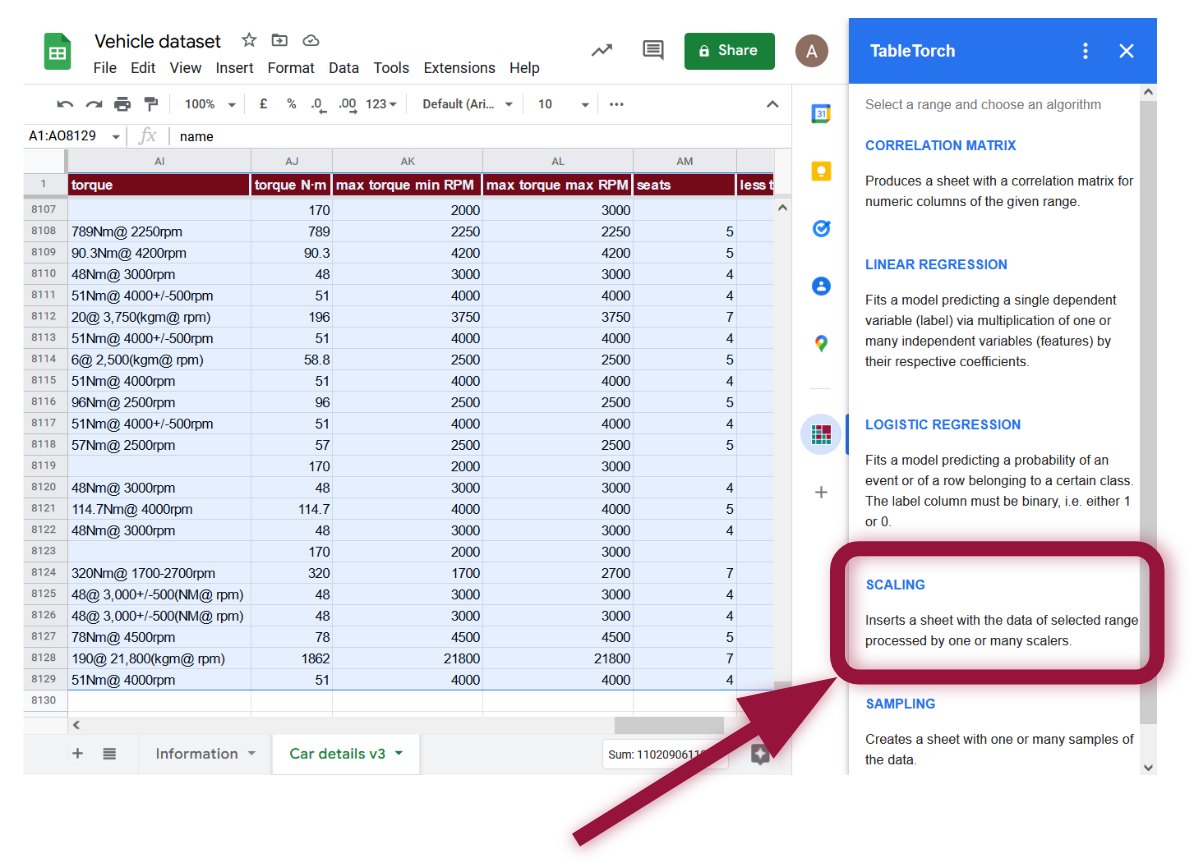
The following menu will appear:
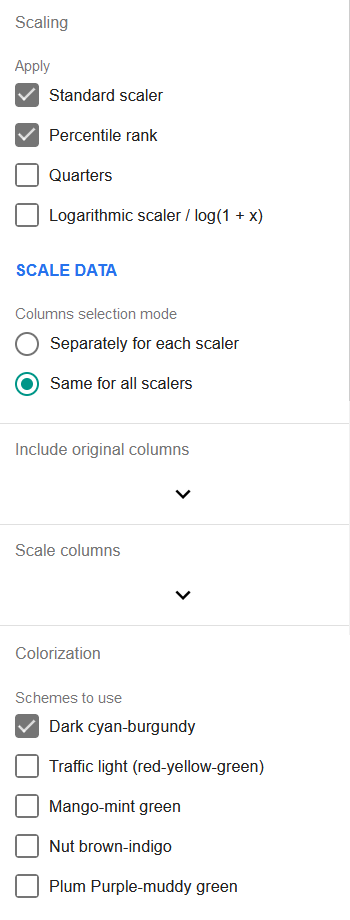
The first section allows to choose scaling algorithms to apply:
-
Standard scaler: subtracts range’s mean value from the row’s value and divides the result by range’s standard deviation.
v = (v0 - mean(V)) / stdDev(V)The scaled value can be interpreted as the count of standard deviations from the mean. Notably, this count can also be negative as the scaled range becomes centered around zero. Standard scaling is so frequently used before regressions that it is integrated in the TableTorch regressions and is enabled by default. Thus, it is unnecessary to use standalone Scaling tool before doing regressions if the only required scaling method is the standard scaling; it can be done inside the regressions tool just as well.
-
Percentile rank: replaces the value with its corresponding percentile in the set. Fractional ranking is used, i.e. ties are assigned their average rank.
-
Quarters: inserts three columns Q2, Q3, and Q4 with a binary value (1 or 0) identifying whether original value lied in the specified quarter of the set or not. Q1 is missing in order to avoid high correlation coefficients among the features and thus facilitate regressions. If the planned analysis of the data is not a regression and Q1 is needed, it can be easily introduced with a formula like this:
=IF(AND(Q2Col = 0, Q3Col = 0, Q4Col = 0), 1, 0) -
Logarithmic scaler / log(1 + x): applies the shown formula to the values of the set. It can be useful for regressions when it is known in advance that the specified features have logarithmic distribution.
The next section contains a selector to choose columns selection mode: whether to apply each of the checked scalers on the same columns or to choose the columns separately for each scaler.
The next two or more sections allow to choose original columns to include in the produced dataset, as well as the columns to be passed through scalers.
The final section of the tool, Colorization allows to enable one or more color schemes to be applied on the columns with scaled data. If more than one scheme is enabled, they will alternate so that it would be easier to distinguish the columns in the produced sheet.
Example with vehicle dataset
Let’s scale a few columns and see whether it could help us improve the regression performance of the selling_price column of vehicle dataset.
-
Check standard scaler, percentile rank and quarters in the algorithms section.
-
Select Separately for each scaler option in the columns choosing mode.
-
Select name and selling_price in the original columns menu.
- Select the following columns for standard scaling:
- year
- max power bhp
- max torque min RPM
- For percentile rank:
- mileage_kmpl
- engine cc
- For quarters:
- km_driven
- torque N·m
- Click Scale data button to produce sheet with the scaled values.
The scaled dataset will look like the following one:
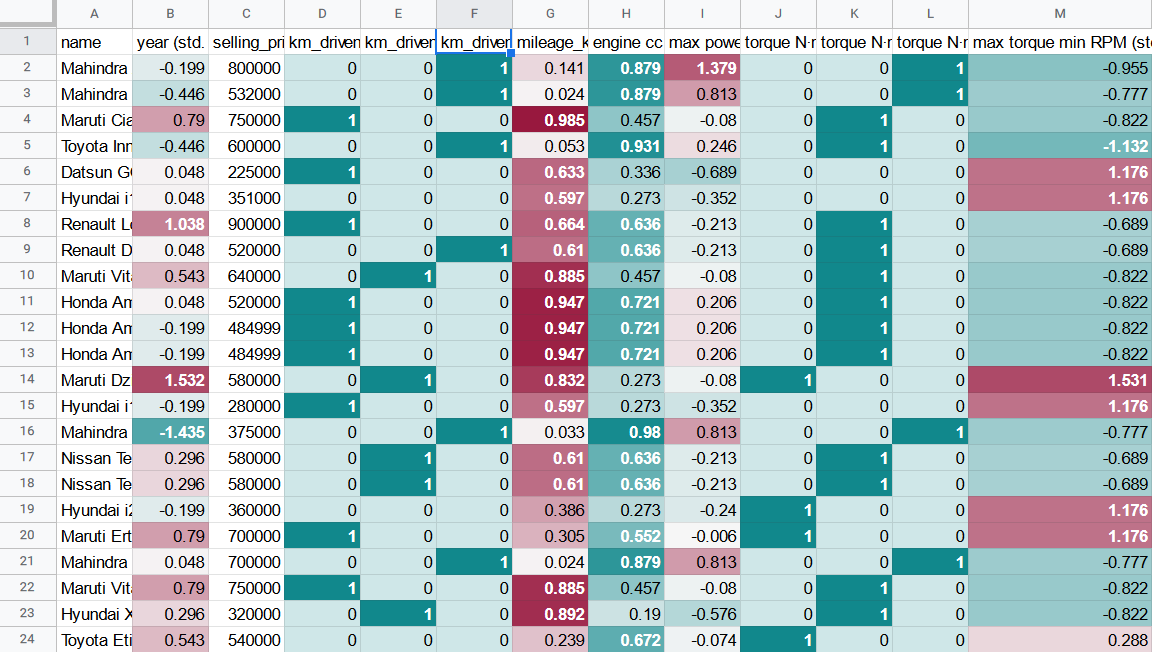
Notice that the scaled columns have been colorized according to the default color scheme that can help with faster visual. data patterns identification.
Formulas
TableTorch copies the data into resulting dataset by values, i.e. formulas are not copied. This is done to speed up the process and avoid exceeding quotas. It is deemed that the produced sheet is of a temporary nature and is useful for subsequent regressions or other data manipulation rather than formula experimentation.
Conclusion
Scaling the features in a way that produces the maximum correlation coefficient with the label may help to improve the performance of linear regression.
See also on Wikipedia:
Google, Google Sheets, Google Workspace and YouTube are trademarks of Google LLC. Gaujasoft TableTorch is not endorsed by or affiliated with Google in any way.
Let us know!
Thank you for using or considering to use TableTorch!
Does this page accurately and appropriately describe the function in question? Does it actually work as explained here or is there any problem? Do you have any suggestion on how we could improve?
Please let us know if you have any questions.
- E-mail: ___________
- Facebook page
- Twitter profile